


Learn more about your usage data
Five new Consumption History features to explore:
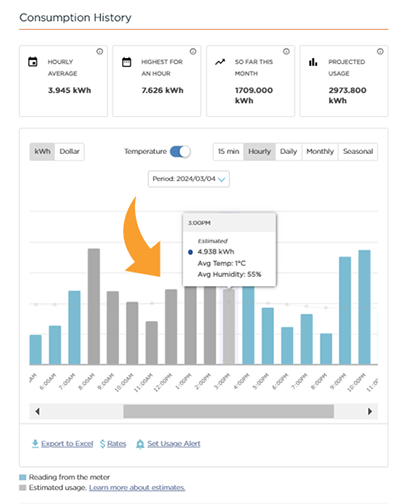
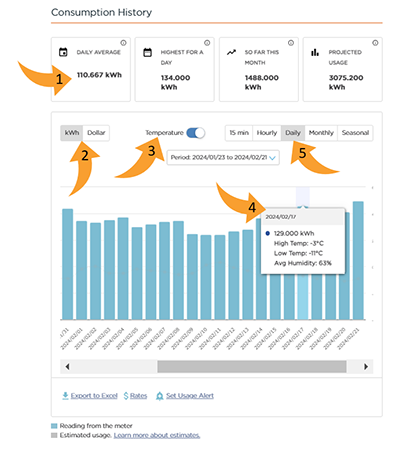
- The boxes above the graph provide key insights about your energy usage, including Highest for a Day and Projected Usage.
- You can choose to view your usage both in kilowatt-hours (kWh) or dollars for budgeting purposes.
- The temperature overlay toggle allows you to see how weather trends impacted your energy use.
- When you click on a bar in the graph, additional information about that time period will pop up, including high and low temperature and humidity.
- Instead of simply seeing monthly and seasonal usage, you can now view your daily, hourly and 15-minute energy use displayed.
New Features
When will I have access to my usage data?
- All customers with an online account can view their monthly usage data.
- When the smart meter for your account is installed and activated you will have access to view your electricity usage by the day, hour, and at 15-minute intervals.
- If you do not have an online NB Power account, you can create one here.
How will I know when I have access?
- We will contact you to let you know when you have access to the new usage graphs enabled by smart meters.
Is my energy use data real-time?
- Not quite—it will typically take about 24 hours for your most recent energy use data to be available.
When is the usage graph updated with new data?
- The monthly and seasonal views are updated when a new bill is issued.
- The daily, hourly and 15-minute graphs are updated daily with usage data up to midnight of the previous day.
How is the temperature determined?
- The temperature shown on the usage graph is based on the nearest weather station to the service address.
- We provide this information to help you better understand how changes in temperature can affect your energy usage and bill.
Why does my bill amount not match what I see as dollar values on the usage graph?
- The dollar amounts shown on the usage graph are based on energy charges only and do not include other fees such as taxes, rental charges or service charges.
I’m enrolled in the Equalized Payment Plan. Will anything change for me?
- No, your equalized monthly payment amount will remain the same so long as you choose to remain on the plan. You can log in to your account at any time to change your monthly amount if you notice an increasing or decreasing trend.
Why am I seeing gaps in my usage data?
- If you see gaps in your usage data, that could mean there were connectivity issues during that time frame.
- If there are any connectivity issues that prevent an accurate reading at the time of billing, an estimated reading will be used and identified as such on the bill.
How is the Energy Usage So Far feature determined?
- The Energy Usage So Far feature is available for customers with a smart meter installed and activated. It helps you track how much energy you’re using before the billing period is over—so you can better control what you’re spending on electricity.
- It is based on the kWh energy used so far in the billing period and is updated daily.
- The dollar view (for residential accounts only) is for electricity usage only and does not include taxes, fees or rentals.
How is the Projected Energy Usage feature calculated on top of the usage graph?
- The Projected Energy Usage feature is available for customers with a smart meter installed and activated. It projects how much electricity you will use in the current billing period based on your current consumption and historical usage.
- The dollar view (for residential accounts only) is for electricity usage only and does not include taxes, fees or rentals.
Estimates
I already received a smart meter, why am I seeing estimates for my usage?
The consumption history graph in your NB Power online account displays your energy usage information to help you understand your consumption patterns.
From time to time, energy usage information from your smart meter may be estimated. You can tell it’s an estimate by the colour of the bar – blue bars represent time periods with readings from the smart meter and grey bars represent time periods with estimated energy usage.
Reasons for estimations may include:
- Connectivity challenges: As we continue to build and strengthen NB Power’s digital communication network, there may be periods of time where the meter can’t connect. Reliability will improve as we finish installing smart meters in communities around the province. Estimates are only used for billing if the meter doesn’t connect at the end of your billing period.
- Planned and unplanned power outages: Over the next couple of years as our systems are built out, during a power outage, our system may not be able to identify that there is no power being fed to the meter and could treat it like a connectivity issue. Once smart meters are installed across the province, we’ll be updating our systems to reflect accurate outage information day to day.